
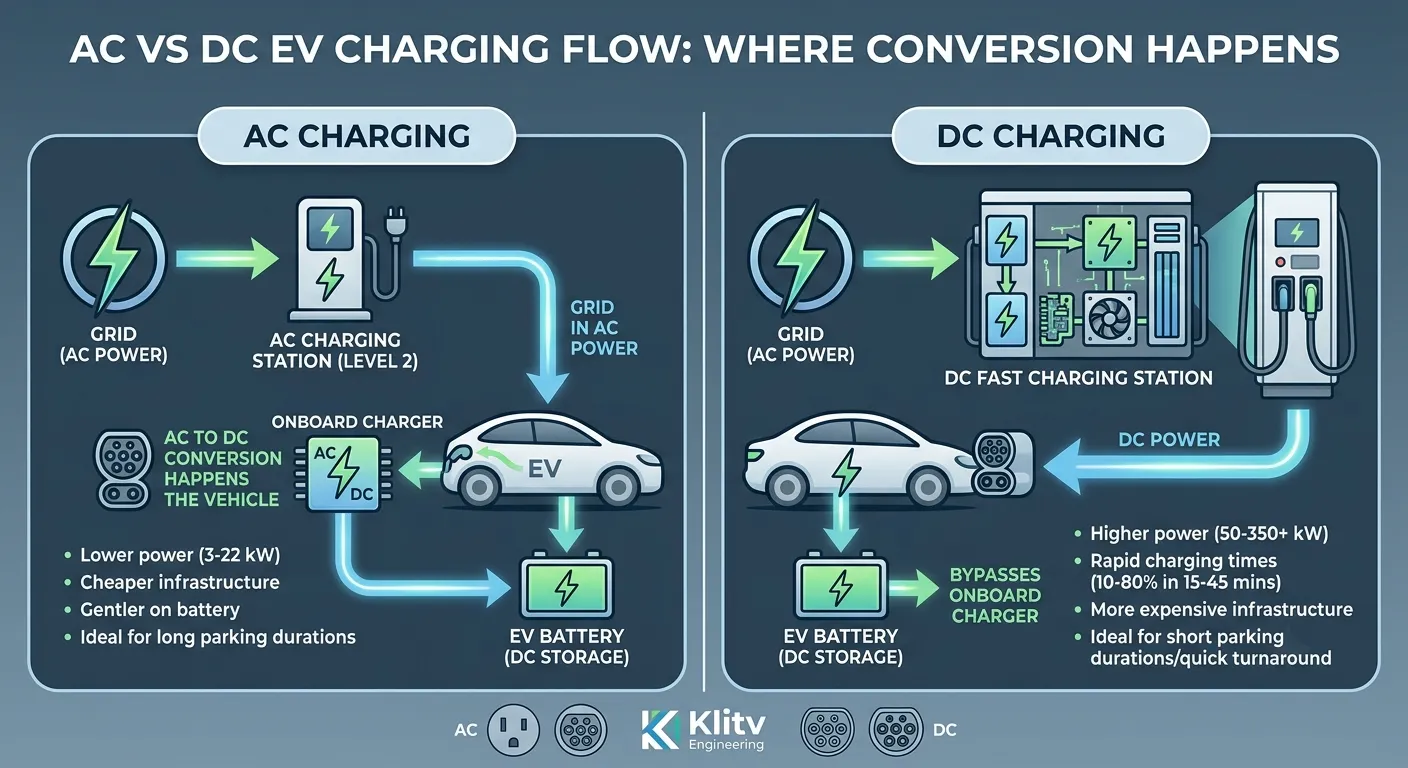
The difference between AC and DC EV charging comes down to where the AC-to-DC conversion happens: AC charging converts power inside your vehicle through an onboard charger (delivering 3 to 22 kW), while DC charging handles conversion at the station itself, bypassing the vehicle’s limits and delivering 50 to 350-plus kW directly to the battery.
When Marcus, a fleet manager in Atlanta, signed off on a $340,000 DC fast charger installation for his 22-vehicle delivery fleet, he thought he was future-proofing his operation. Six months later, he was staring at a $4,200 monthly demand charge bill, and 18 of his vehicles sat idle for 11 hours every night, plugged into expensive DC units they simply didn’t need. Marcus learned what this guide will show you: getting the AC/DC mix right isn’t about buying the fastest charger you can afford. It’s about matching charging speed to how long vehicles actually sit still.
You’ve probably heard that DC fast charging is the future and that AC is “too slow” for commercial use. That’s partially true, and partially an expensive oversimplification. By the end of this guide, you’ll have a clear framework for deciding exactly how many AC and DC chargers your project needs, what the real five-year costs look like, and how to avoid the most common six-figure deployment mistake.
Key Takeaways
- AC charging uses your vehicle’s onboard converter (3–22 kW); DC charging converts power at the station (50–350+ kW), bypassing the vehicle’s bottleneck entirely
- A 20-vehicle fleet saves $380,000-plus over five years with an AC-majority strategy (18 AC + 2 DC) compared to an all-DC approach
- Demand charges from a single 15-minute 150kW DC peak can add $1,200 to $2,400 per month to your electricity bill, often 60 to 80 percent of total operating cost at low-utilization sites
- Match charger speed to dwell time: vehicles parked 8-plus hours need AC Level 2; vehicles turning over in under 2 hours need DC fast charging
- Klitv provides both AC and DC chargers with integrated smart CMS, so you get an unbiased recommendation on the right mix for your specific site
The Fundamental Difference: Where AC-to-DC Conversion Happens
Every EV charger draws alternating current (AC) from the grid. But EV batteries can only store direct current (DC). Somewhere in the chain, AC must become DC. Where that conversion occurs is the entire difference between AC and DC charging, and it determines everything about speed, cost, and infrastructure requirements.
How AC Charging Works: The Onboard Converter
With AC charging, the station passes grid power directly to the vehicle. The car’s built-in onboard charger handles the AC-to-DC conversion internally before feeding power to the battery.
Think of it as filling a swimming pool with a garden hose. It’s reliable, gentle, and inexpensive, but the hose diameter, your vehicle’s onboard charger, sets a hard limit on how fast water flows. Most passenger EVs have onboard chargers rated between 7.2 kW and 11 kW, with some premium models reaching 22 kW. Even if you plug into a 22 kW AC station, a vehicle with a 7.2 kW onboard charger will cap at exactly 7.2 kW.
This limitation is why AC charging is ideal for long-dwell scenarios. When a vehicle sits for eight hours overnight, adding 50 kilometers of range per hour through a 7 kW charger delivers a full 400 kilometers by morning, more than enough for most daily routes.
How DC Charging Works: The External Converter
DC fast charging moves the heavy lifting outside the vehicle. The charging station contains industrial-grade rectifiers and thermal management systems that convert AC to DC before power reaches the car. DC electricity flows directly into the battery, bypassing the onboard charger entirely.
This time, think of a fire hose connected to an industrial pump. The volume is dramatically higher, but so is the infrastructure cost behind it. DC stations range from 50 kW to over 350 kW, enabling a 10-to-80-percent charge in 15 to 45 minutes for most modern EVs.
The trade-off is complexity. DC stations require dedicated transformers, high-voltage switchgear, concrete mounting pads, and extensive utility coordination. Installation timelines stretch from six to 18 months, not days.
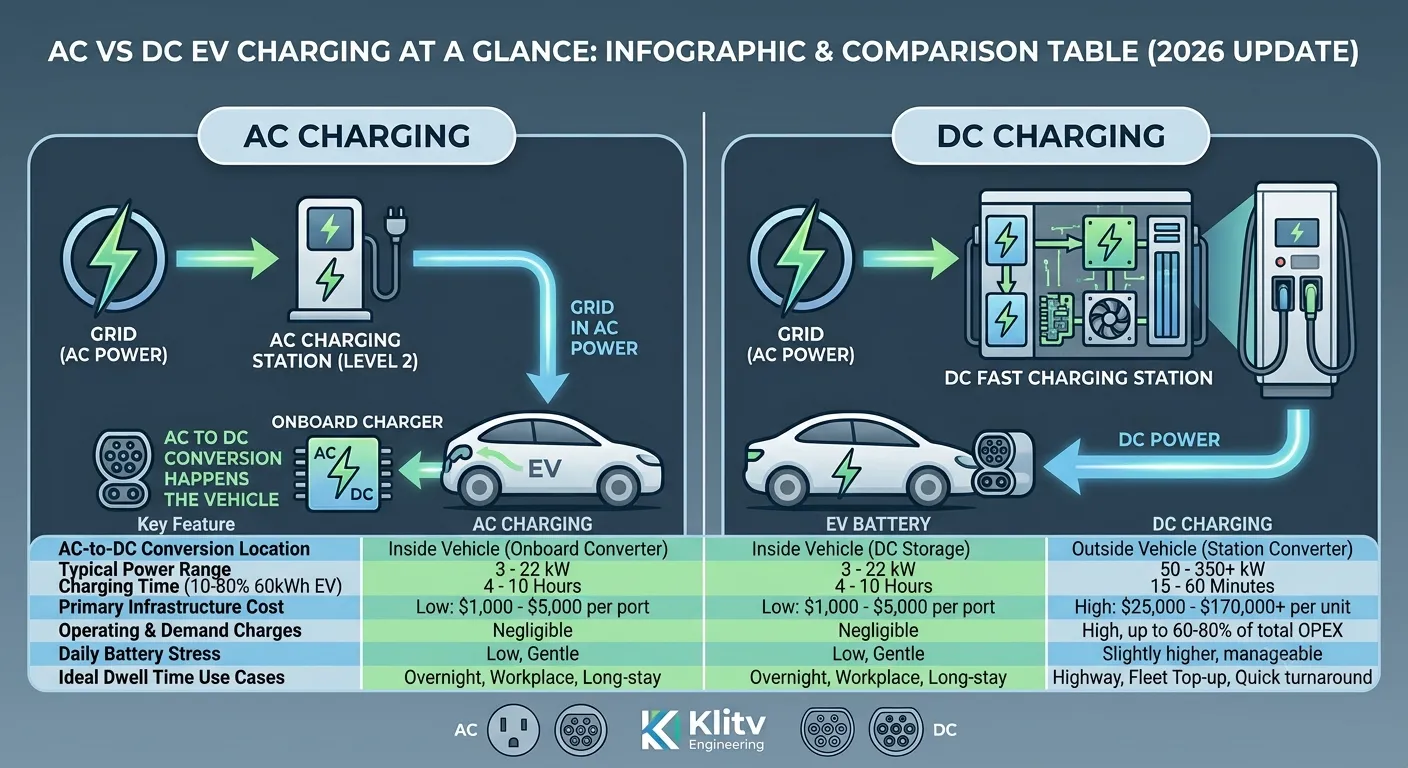
AC vs DC Charging at a Glance
| Factor | AC Charging (Level 2) | DC Fast Charging |
|---|---|---|
| Conversion Location | Inside vehicle (onboard charger) | Inside charging station |
| Typical Power Range | 3–22 kW | 50–350+ kW |
| 10–80% Charge (60 kWh EV) | 4–10 hours | 15–60 minutes |
| Equipment Cost (per port) | $1,000–$5,000 | $25,000–$170,000+ |
| Installation Time | Days to weeks | 6–18 months |
| Best Fit | Overnight, workplace, hotel, long-stay | Highway corridors, quick-turnover hubs, fleet midday top-ups |
AC vs DC Charging Speed: What to Actually Expect
Charging speed isn’t just about the number printed on the station. Two real-world factors dramatically affect how fast your vehicles charge: the non-linear DC charging curve and the vehicle’s own onboard charger limit.
Real-World Charging Times by Power Level
For a typical 60 kWh battery charging from 10 to 80 percent:
| Charger Type | Power | Range Added Per Hour | 10–80% Time | Best Use Case |
|---|---|---|---|---|
| AC Level 1 | 1–3 kW | 5–10 km | 20–40+ hours | Emergency or legacy only |
| AC Level 2 (7 kW) | 7 kW | 35–50 km | 6–8 hours | Home, workplace overnight |
| AC Level 2 (11 kW) | 11 kW | 55–70 km | 4–6 hours | Workplace, hotel, destination |
| AC Level 2 (22 kW) | 22 kW | 100–130 km | 2–3 hours | Commercial sites with compatible vehicles |
| DC Fast (50 kW) | 50 kW | 180–250 km | 50–70 minutes | Urban public charging, retail parking |
| DC Fast (150 kW) | 150 kW | 400–550 km | 20–30 minutes | Highway corridors, fleet turnaround |
| DC Ultra-Fast (350 kW) | 350 kW | 600–800 km | 12–18 minutes | Major highway hubs, heavy-duty vehicles |
Why DC Charging Slows Down After 80 Percent
DC fast charging follows a non-linear curve. Power flows at peak rates between roughly 10 and 60 percent state of charge, then progressively tapers. Above 80 percent, charging speed drops significantly, often to 10 to 50 kW, as the battery management system (BMS) reduces current to protect cell health and manage heat.
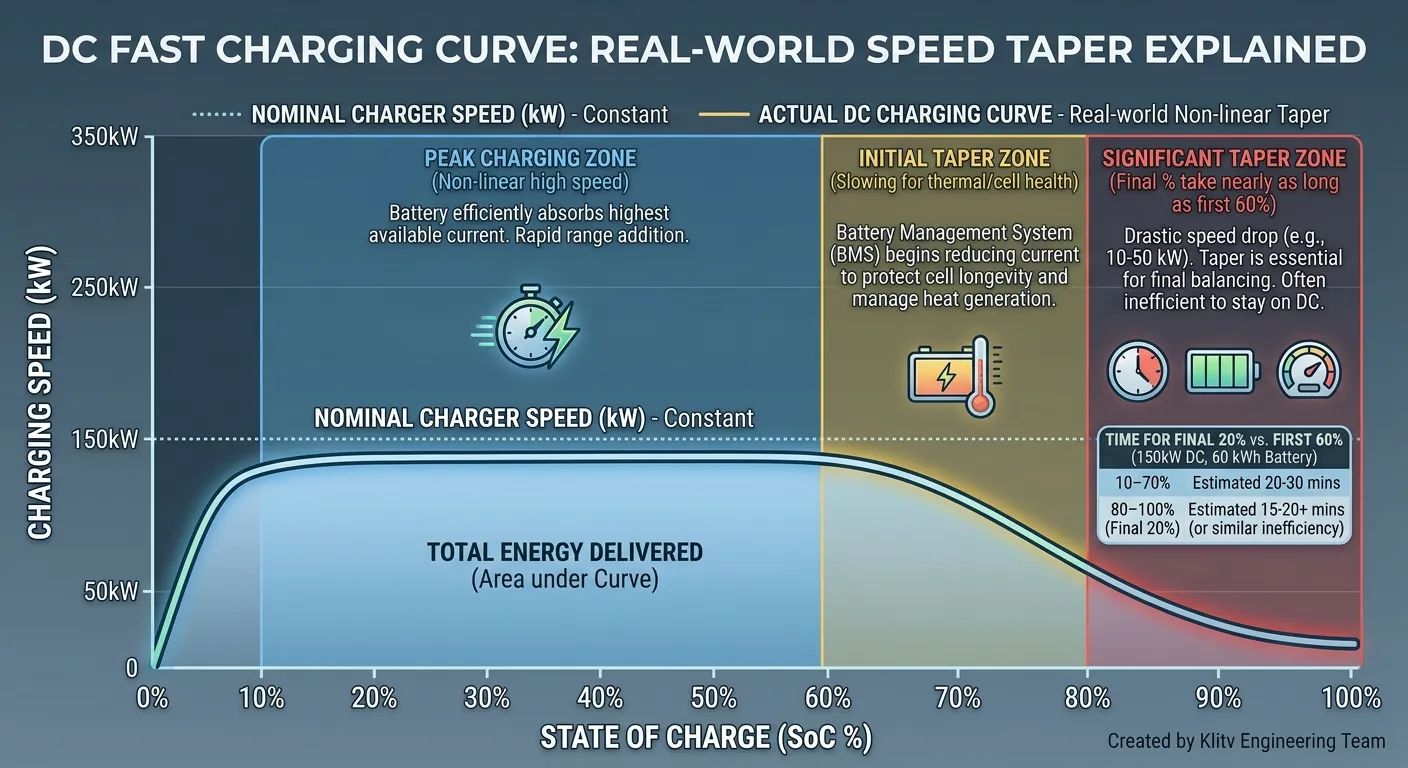
This means the final 20 percent of a DC charge can take nearly as long as the first 60 percent. For most commercial operations, charging beyond 80 percent on DC is inefficient. It ties up an expensive asset delivering minimal throughput.
The Vehicle Constraint Most Buyers Miss
Sarah, an operations director at a logistics company in Frankfurt, ordered ten 22 kW AC chargers for her new depot, expecting rapid overnight turnaround. What she didn’t check was her fleet’s onboard charger ratings. Her vehicles were equipped with 7.2 kW onboard chargers. Despite the 22 kW stations, each vehicle pulled exactly 7.2 kW, tripling her expected charge time and nearly derailing the morning dispatch schedule.
This is one of the most common and costly oversights in commercial EV infrastructure planning: AC charging speed is always capped by the vehicle’s onboard charger, not the station’s rating. Before selecting chargers, verify your fleet’s actual onboard charging capacity. A 22 kW station paired with a 7.2 kW vehicle delivers 7.2 kW. Period.
Cost Comparison: AC vs DC Total Cost of Ownership
The equipment price tag is only the beginning. Installation, operating costs, and demand charges create a total cost picture that surprises many first-time infrastructure buyers.
Equipment and Installation Costs
| Cost Category | AC Level 2 (per port) | DC 50–150 kW (per unit) | DC 350 kW+ (per unit) |
|---|---|---|---|
| Equipment | $1,000–$5,000 | $25,000–$100,000 | $115,000–$170,000 |
| Installation | $2,000–$6,600 | $45,000–$80,000 | $65,000–$100,000+ |
| Transformer & Utility Work | Usually not required | $15,000–$50,000+ | $25,000–$70,000+ |
| Timeline | Days to 2 weeks | 6–12 months | 12–18 months |
A single 208V/400A commercial electrical panel illustrates the capacity trade-off starkly: it can support roughly 10 to 15 AC Level 2 ports at 7 kW each, or exactly one 50 kW DC fast charger.
Demand Charges: The Hidden DC Operating Cost
Demand charges are calculated based on your highest 15-minute power draw in a billing cycle, and they disproportionately penalize DC fast charging. When a 150 kW DC charger hits peak output for just 15 minutes, it can generate $1,200 to $2,400 in fixed monthly demand charges, regardless of how little the station is used the rest of the month.
At low-utilization DC sites, demand charges frequently represent 60 to 80 percent of the total electricity bill. AC charging, with its lower and more consistent power draw, largely avoids this penalty.
Per-kilowatt-hour, home and depot AC charging typically costs $0.06 to $0.12 (off-peak), compared to $0.30 to $0.50-plus for public DC fast charging.
Five-Year TCO: A 20-Vehicle Fleet Comparison
Let’s return to Marcus in Atlanta, now with a clearer picture of what the numbers actually show:
| Strategy | Equipment + Install | 5-Year Demand Charges | 5-Year Maintenance | Total 5-Year Cost |
|---|---|---|---|---|
| All-DC (10 × 50 kW) | $500,000–$700,000 | $180,000–$350,000 | $45,000–$90,000 | $725,000–$1,140,000 |
| AC-Majority (18 AC + 2 DC) | $90,000–$140,000 | $25,000–$50,000 | $12,000–$20,000 | $127,000–$210,000 |
| Savings with AC-Majority | , | , | , | $380,000–$930,000 |
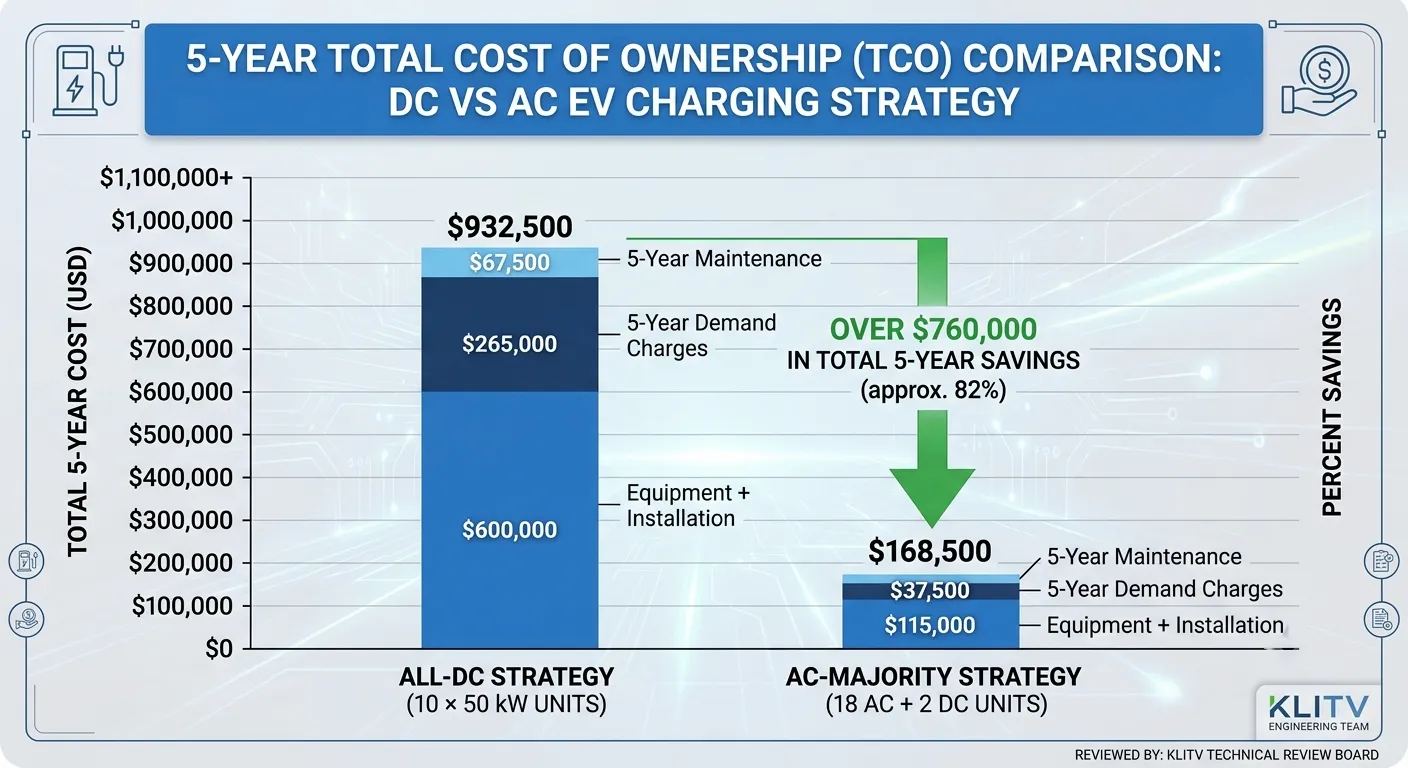
The math is clear: for fleets with predictable overnight dwell times, an AC-majority approach generates enormous savings without sacrificing operational capability.
Want to run these numbers for your specific fleet? Use Klitv’s free ROI calculator to model your exact equipment mix, local electricity rates, and projected utilization.
Battery Health: Does DC Fast Charging Affect EV Battery Life?
Higher charging currents generate more heat, and heat accelerates chemical degradation in lithium-ion cells. The question is how much this matters in practice.
What the Data Shows
According to Geotab’s 2025 analysis of over 22,700 EVs, vehicles that rely primarily on AC charging show approximately 1.5 percent annual battery capacity loss. Vehicles that use heavy DC fast charging show 2 to 3 percent annual loss.
The gap is real but modest. For a vehicle with 400 kilometers of original range, heavy DC fast charging might reduce that to roughly 388 kilometers after three years versus 394 kilometers with primarily AC charging. Most fleet operators won’t notice the difference in daily operations.
LFP (lithium iron phosphate) battery chemistry, increasingly common in commercial EVs, shows better tolerance to fast charging than NMC (nickel manganese cobalt) chemistry. Modern battery management systems also actively regulate temperature during DC sessions, narrowing the degradation gap further.
Practical Guidance for Fleet Operators
Use AC as your daily charging workhorse. It’s gentler on batteries and significantly cheaper per kilowatt-hour. Reserve DC fast charging for tactical situations: multi-shift vehicle turnaround, unexpected range needs, and midday top-ups during peak operational periods. Occasional DC sessions will not meaningfully shorten battery life.
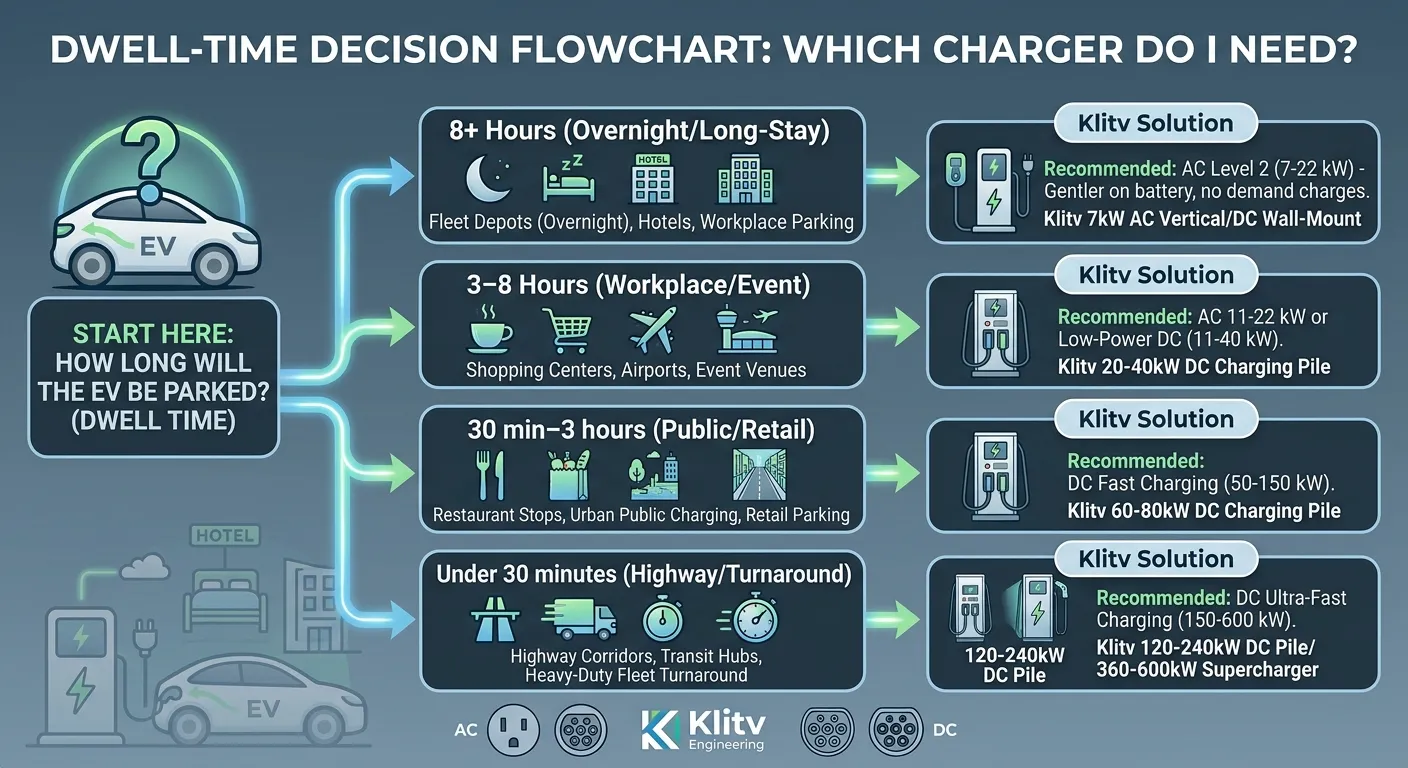
How to Choose: The Dwell-Time Decision Framework
The most reliable way to determine your AC/DC mix is to match charger power to how long each vehicle sits parked. This approach removes guesswork and ties every hardware dollar to an actual operational requirement.
Match Charger Speed to Parking Duration
| Dwell Time | Recommended Charger | Power | Example Locations | Klitv Solution |
|---|---|---|---|---|
| 8+ hours | AC Level 2 | 7–22 kW | Fleet depots (overnight), workplace parking, hotels, residential | 7kW AC Vertical, 7kW DC Wall-Mount |
| 3–8 hours | AC 11–22 kW or low-power DC | 11–40 kW | Shopping centers, airports, event venues | 20-40kW DC Charging Pile |
| 30 min–3 hours | DC Fast | 50–150 kW | Retail parking, restaurant stops, urban public charging | 60-80kW DC Charging Pile |
| Under 30 minutes | DC Ultra-Fast | 150–600 kW | Highway corridors, transit hubs, heavy-duty fleet turnaround | 120-240kW DC Pile, 360-600kW Liquid Cooling Supercharger |
The Deployment Sequence
The Klitv engineering team has supported hundreds of global charging projects, and one pattern repeats across failed deployments: buyers purchase hardware first, then discover their electrical capacity doesn’t support it.
Follow this sequence before committing to any hardware purchase:
- Electrical capacity audit: Determine your available power (kVA), spare panel capacity, and transformer headroom.
- Dwell-time analysis: Map the actual parking duration for every vehicle in your fleet or every parking bay at your site.
- AC/DC ratio decision: Apply the dwell-time table above to determine how many ports of each type you need.
- Smart management platform: Select a CMS that manages both AC and DC from a single dashboard, like Klitv’s integrated platform.
- Hardware procurement: Only now, with requirements defined, select specific charger models.
Skipping steps one and two is how six-figure deployment failures happen.
Real Klitv Project Examples: AC/DC Strategy in Practice
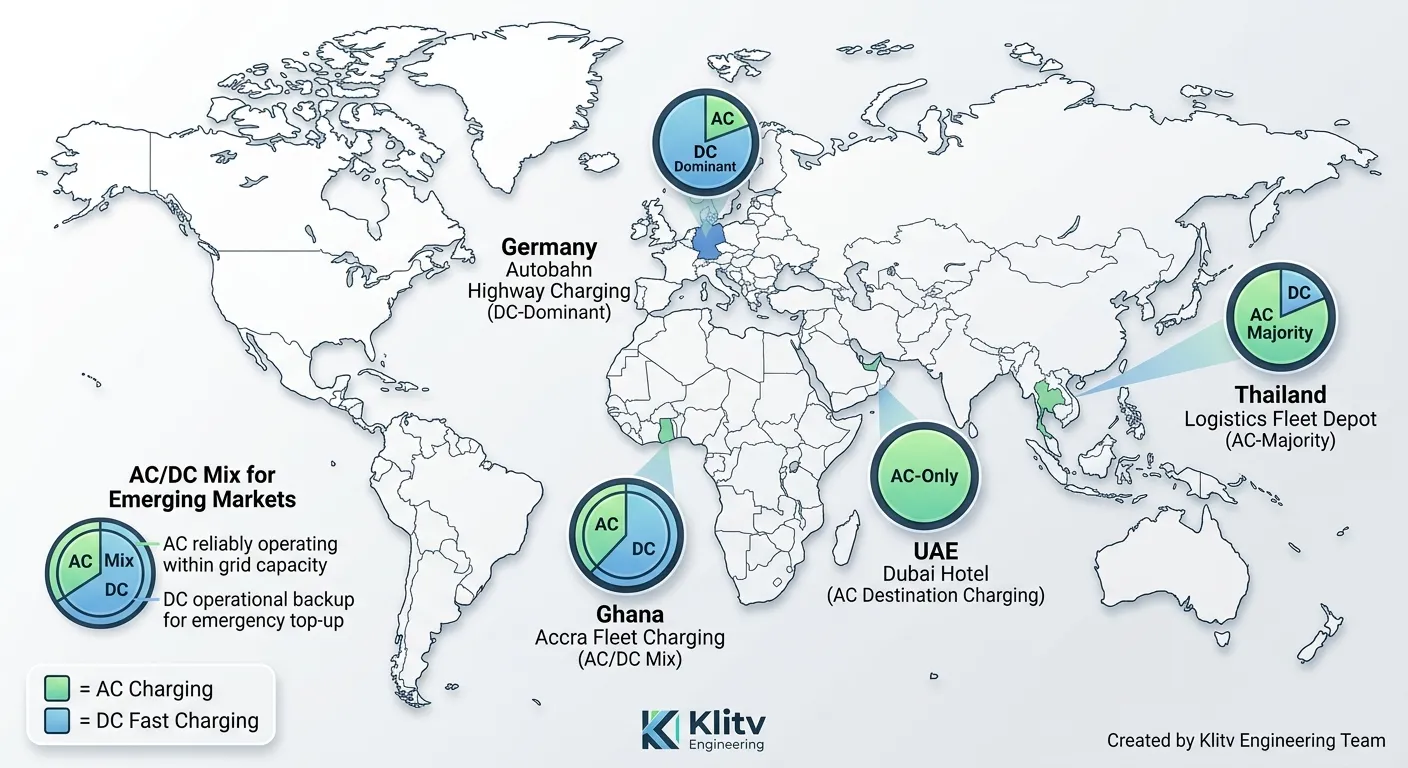
These four projects, from Klitv’s global portfolio, demonstrate how the AC/DC mix shifts depending on site-specific dwell times, grid conditions, and operational priorities.
Germany Autobahn Highway Charging: DC-Dominant
A highway service area along the German Autobahn needed to serve passenger vehicles and light commercial traffic with typical dwell times of 15 to 35 minutes. The site selected Klitv’s 120-240kW DC charging piles as the primary hardware, with the 2.0mm thickened steel body providing dependable outdoor performance through harsh European winters. Two AC Level 2 units were added for staff and extended-stay visitors. This DC-dominant design matches the speed requirement: drivers stop, charge, and return to the highway within a standard rest break.
Thailand Logistics Fleet Depot: AC-Majority
A logistics operator outside Bangkok runs a 30-vehicle delivery fleet with a predictable overnight dwell window of 11 to 13 hours. The depot installed 24 AC Level 2 chargers as the charging backbone, supplemented by two 60 kW DC units for the three multi-shift vehicles that run daytime routes and need midday top-ups. The AC-majority approach reduced total project cost by over 60 percent compared to the original all-DC proposal, and operating costs remain low because overnight charging takes advantage of off-peak electricity rates without triggering demand charges.
UAE Dubai Hotel: AC Destination Charging
A luxury hotel in Dubai added EV charging as a guest amenity for a mixed audience of short-stay business travelers and extended-stay leisure guests. With typical parking durations of 8 to 14 hours, the hotel installed Klitv 7 kW and 22 kW AC chargers with a branded guest interface. The AC-only approach was the clear operational fit, there was zero need for DC speed when every vehicle would be parked overnight. The smart CMS integration allows the hotel to offer complimentary charging to suite guests while billing standard rooms through the property management system.
Ghana Accra Fleet Charging: AC/DC Mix for Emerging Markets
A fleet operator in Accra faced a common emerging-market challenge: limited and sometimes unstable grid supply. Klitv engineers worked with the local team to design an AC-majority layout with one DC unit as operational backup. The AC chargers, drawing lower and more consistent power, operate reliably within the available grid capacity, while the DC unit serves emergency top-up needs. The installation demonstrated that AC/DC strategy isn’t just about speed and cost, in markets with grid constraints, it’s also about what the local electrical infrastructure can actually support.
Planning a multi-site or international charging deployment? Contact Klitv’s engineering team for a free technical consultation tailored to your specific locations and operational requirements.
Key Technical Standards: AC and DC Connectors and Protocols
Knowing which connector standards apply in your deployment region prevents costly compatibility errors.
| Standard | Type | Region | Charging Mode | Connector Notes |
|---|---|---|---|---|
| J1772 (Type 1) | AC | North America | Level 1 & 2 | Common on all non-Tesla EVs |
| Type 2 (Mennekes) | AC | Europe, Global | Level 2 | Standard across EU; also used in Australia, Middle East, parts of Asia |
| GB/T AC | AC | China | Level 2 | China-specific AC standard |
| CCS1 | DC | North America | Fast/Ultra-Fast | Combines J1772 with two DC pins |
| CCS2 | DC | Europe, Global | Fast/Ultra-Fast | Combines Type 2 with two DC pins |
| NACS (SAE J3400) | DC | North America | Fast/Ultra-Fast | Originally Tesla connector; now adopted by most automakers for 2025+ models |
| CHAdeMO | DC | Japan, Legacy Global | Fast | Declining; primarily Nissan Leaf and Mitsubishi Outlander PHEV |
| GB/T DC | DC | China | Fast/Ultra-Fast | China-specific DC standard |
For network management, both AC and DC chargers from Klitv support OCPP 1.6J communication protocol, enabling seamless integration with any compatible Charging Management System (CMS). AC chargers use basic PWM (pulse-width modulation) signaling through the Control Pilot pin for safety handshakes, while DC chargers employ more advanced digital communication via CAN bus or power-line communication (PLC).
Future Trends in AC and DC Charging
800V Architecture and Megawatt Charging
New EV platforms from manufacturers including Hyundai, Kia, Porsche, and Lucid use 800-volt battery architectures that support 350 kW-plus charging speeds. On the heavy-duty side, the Megawatt Charging System (MCS) standard targets 1 to 3.75 MW for electric trucks and buses. Klitv’s 360-600kW liquid-cooled supercharger is positioned to serve both current 800V passenger vehicles and emerging MCS applications at bus depots and truck terminals.
Bidirectional Charging (V2G)
Vehicle-to-grid (V2G) technology lets EVs return power to the grid or building during peak demand. Both AC and DC pathways are developing: AC V2G routes power back through the onboard charger, while DC V2G uses an external bidirectional inverter. For fleet operators with predictable downtime, V2G could eventually turn parked vehicles into revenue-generating grid assets, but the standards and regulations are still maturing in most markets.
AI-Driven Smart Charging
The most impactful near-term development is AI-based load management that dynamically allocates power across AC and DC ports based on real-time factors: vehicle state of charge, electricity pricing, grid load, and scheduled departure times. Klitv’s CMS platform integrates both AC and DC charger management in a single interface, with automated load balancing that prevents circuit overloads while maximizing the number of vehicles served from available electrical capacity.
Conclusion
AC and DC charging are not competing technologies. They serve different but complementary roles in a well-designed charging infrastructure. AC charging, slower, cheaper to install, gentler on batteries, and free from punishing demand charges, is the correct backbone for any site where vehicles park for four hours or more. DC fast charging is indispensable when speed matters: highway corridors, multi-shift fleet operations, and high-turnover public stations.
The question isn’t “AC or DC?” It’s “what’s the right ratio for my specific site?” For most commercial deployments, an AC-majority strategy with strategic DC placement delivers the best combination of operational capability and total cost of ownership. The $380,000-plus in five-year savings that comes from getting this ratio right is too significant to leave to guesswork.
Klitv provides both AC and DC chargers, from 7 kW wall-mounted units to 600 kW liquid-cooled superchargers, with integrated smart CMS management across the full product line. Our 800-plus engineering team works with you to perform the electrical capacity audit, dwell-time analysis, and AC/DC ratio planning that ensures your deployment succeeds from day one.
Ready to plan your AC/DC charging mix? Contact Klitv today for a free technical consultation and customized project proposal.