
China’s EV charger penetration rate reached a vehicle-to-charger ratio of approximately 1.9:1 by the end of 2025, meaning there is nearly one charging point for every two electric vehicles on Chinese roads. With over 20 million total chargers deployed across the country, China now hosts roughly 67% of the world’s public charging infrastructure.
When Carlos, a charging station developer based in São Paulo, began sourcing hardware for a 40-site commercial network in early 2026, he started with European suppliers. The quotes came back at €18,000 per 120kW unit with 14-week lead times. His project budget could not absorb it.
A colleague pointed him toward the data behind those numbers. The same manufacturing ecosystem that deployed 20 million chargers across China in under two decades was now exporting hardware at roughly 40% lower cost, with comparable certifications. Carlos shifted his sourcing strategy and cut his equipment budget by a third. His first 10 stations went live last month.
This article breaks down the latest China EV charger penetration data, compares it against global benchmarks, and explains what the numbers mean for infrastructure buyers evaluating their sourcing options.
Key Takeaways
- China reached 20.09 million charging points by end of 2025, achieving a vehicle-to-charger ratio of ~1.9:1, improving from 3.5:1 in 2020.
- 49% of public chargers are DC fast chargers, the highest share of any country and nearly double the US rate of 28%.
- A widening structural gap exists: public charger growth covers only about 12% of new EVs that lack home charging access.
- The “Three-Year Doubling Action Plan” targets 28 million chargers by 2027, backed by over ¥200 billion ($28 billion) in investment.
- For global project developers, China’s domestic deployment scale translates into proven manufacturing reliability and competitive export pricing.
China EV Charger Penetration Rate: The Key Numbers (2024–2026)
Understanding China’s charger penetration requires looking beyond a single ratio. The headline figure masks a more complex story of public versus private infrastructure, regional concentration, and a rapid shift toward high-power DC fast charging.
Total Infrastructure Growth: From 1 Million to 20 Million
China’s charging infrastructure expansion has followed an accelerating curve. The first million chargers took 13 years to deploy, reaching that milestone in June 2019. The jump from 1 million to 10 million took another five years. Then the pace shifted dramatically: 10 million to 20 million happened in just 18 months, between mid-2024 and December 2025.
| Year | Total Chargers | Public Chargers | Private Chargers | Vehicle-to-Charger Ratio |
|---|---|---|---|---|
| 2020 | ~1.68 million | ~0.81 million | ~0.87 million | 3.5:1 |
| 2022 | ~5.21 million | ~1.80 million | ~3.41 million | 2.7:1 |
| 2023 | ~8.86 million | ~2.73 million | ~6.13 million | 2.3:1 |
| 2024 | ~12.82 million | ~3.58 million | ~9.24 million | 2.1:1 |
| 2025 | 20.09 million | 4.72 million | 15.38 million | ~1.9:1 |
| 2026E | ~25–29 million | ~6.21 million | ~22.79 million | ~1.7:1 |
Sources: National Energy Administration, China EV Charging Infrastructure Promotion Alliance (EVCIPA), InsideEVs.
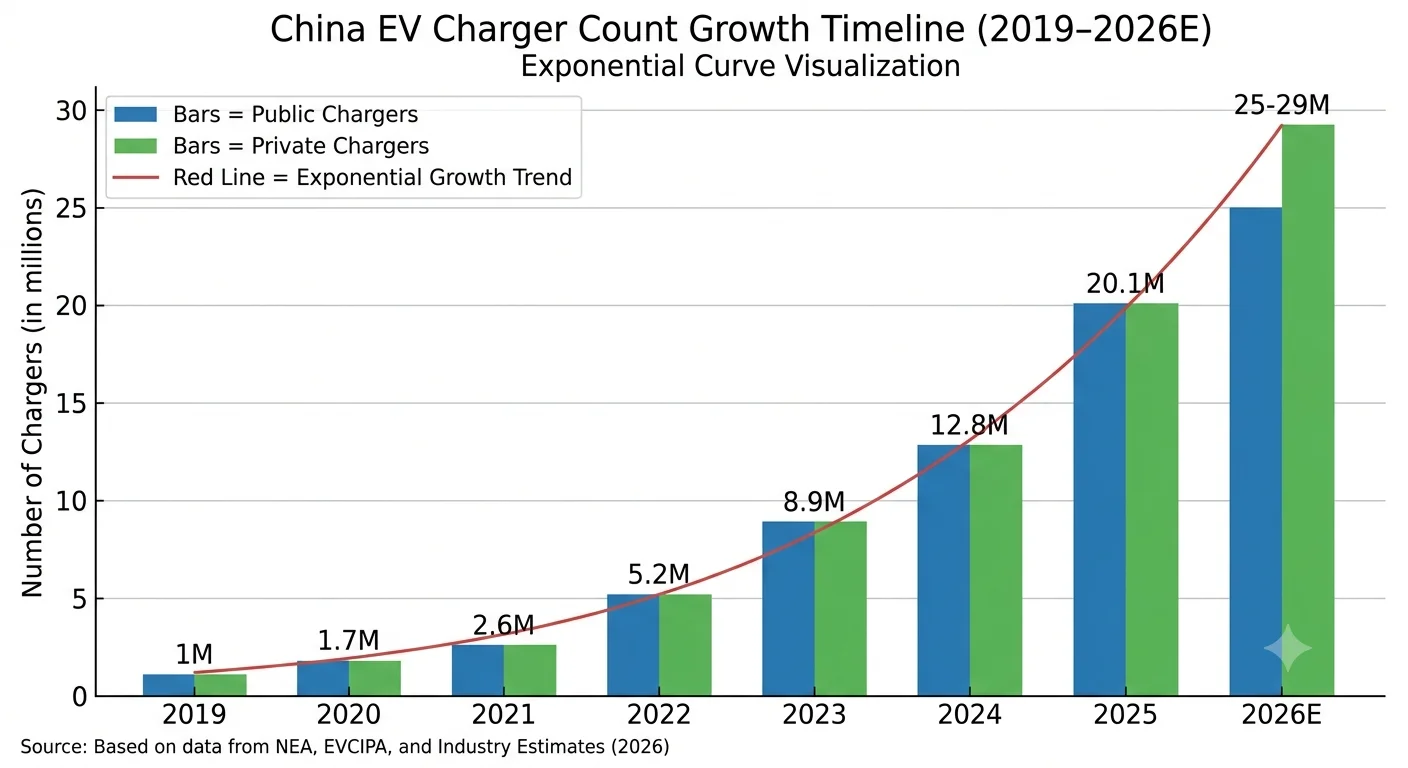
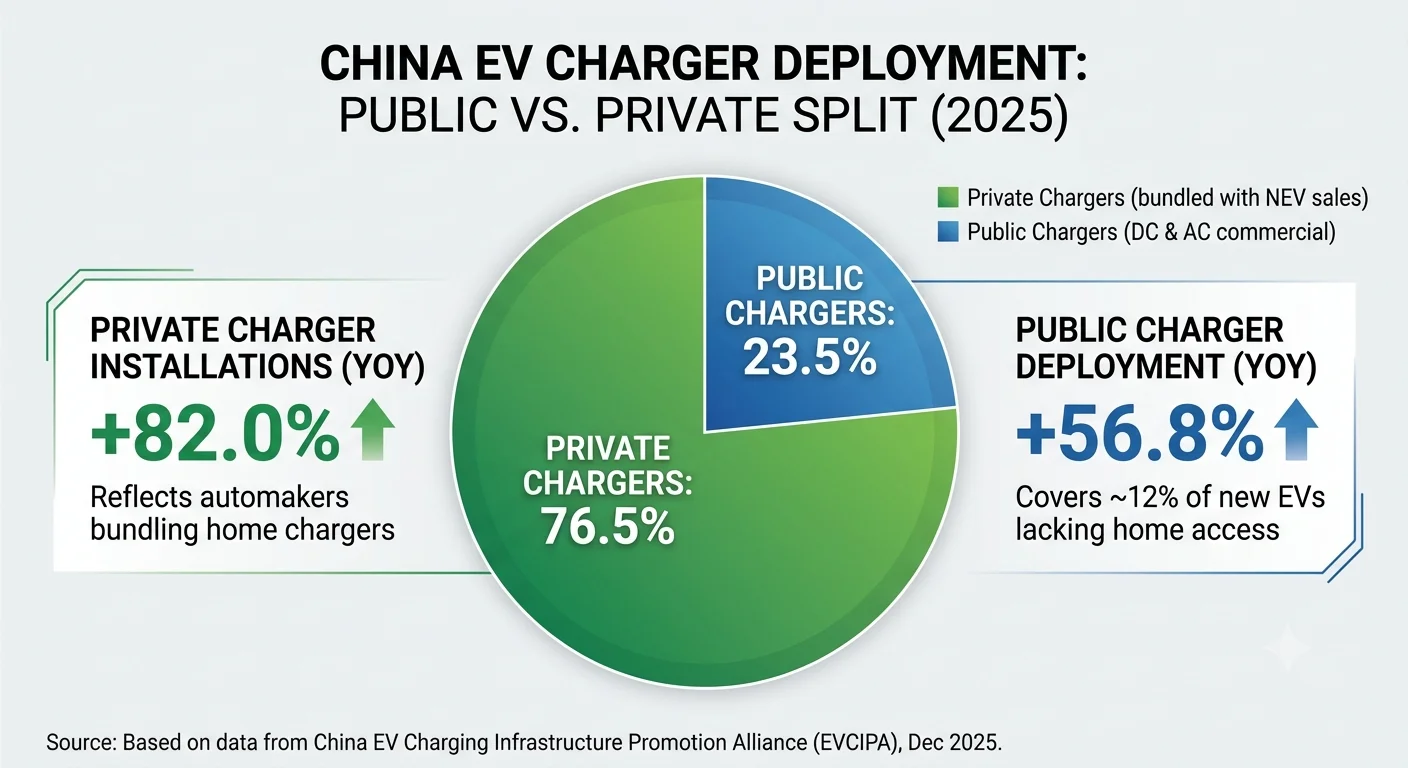
In 2025 alone, China added 7.27 million new charging points, a 56.8% year-over-year increase. Private charger installations surged 82%, far outpacing the 28.2% growth rate of new energy vehicle (NEV) sales during the same period. This was the year private charging infrastructure decisively pulled ahead.
Public vs. Private Chargers: The Widening Structural Divide
The most important trend within the penetration data is the growing gap between private and public charging deployment.
Private chargers now account for 76.5% of all charging points in China, up from 72.1% in 2024. This reflects an accelerating trend: automakers increasingly bundle home chargers with vehicle purchases, and among new EV buyers, the share who install a private charger rose from just 17% in 2021 to approximately 35% by mid-2025.
Public charger growth is not keeping pace with vehicles that depend on it. When you exclude EVs that come with dedicated private chargers, the public vehicle-to-charger ratio worsens to roughly 9:1. More concerning, new public charger additions in the first half of 2025 covered only about 11.5% of newly sold EVs that lacked home charging capability.
This is the hidden story beneath the headline penetration rate. For charging station operators and commercial infrastructure developers, it signals sustained demand for public charging, and the commercial opportunity that comes with it.
Fast Charger Penetration: Where China Really Leads
If there is one metric where China separates itself from every other market, it is DC fast charging penetration. Approximately 49% of China’s public chargers are DC fast chargers, compared to 28% in the United States, 25% in Germany, and just 3% in the Netherlands.
The numbers behind this leadership are striking:
- Average public charger power in China reached 46.5 kW by end of 2025, a 33% increase in a single year.
- The top five charging operators alone had deployed over 202,000 chargers rated above 250 kW.
- Megawatt-level (1MW+) charging stations are already operational, with BYD’s “Flash Charging” technology claiming a 10–70% charge in roughly five minutes.
- More than 37,000 ultra-fast charging units now achieve what the industry calls “1 km per second” charging speeds.
This is not just about technology demonstrations. China’s fast charger density has real economic implications: it shortens vehicle turnaround times, increases station throughput, and makes commercial charging operations more viable as businesses.
China vs. the World: Charger Density Global Comparison
How does China’s charger penetration compare globally? The answer depends on which metric you prioritize.
Where China Ranks by Public Charger Density
The standard international metric compares the number of electric vehicles per public charger. On this measure, as of Q3 2025:
| Rank | Country | EVs per Public Charger | Fast Charger Share |
|---|---|---|---|
| 1 | Netherlands | 5 | 3% |
| 2 | China | 9 | 49% |
| 3 | Italy | 10 | 26% |
| 4 | Spain | 11 | 31% |
| 5 | France | 13 | 21% |
| 8 | Germany | 19 | 25% |
| 9 | United Kingdom | 26 | 20% |
| 10 | United States | 31 | 28% |
Source: Benchmark Mineral Intelligence, Visual Capitalist, Q3 2025.
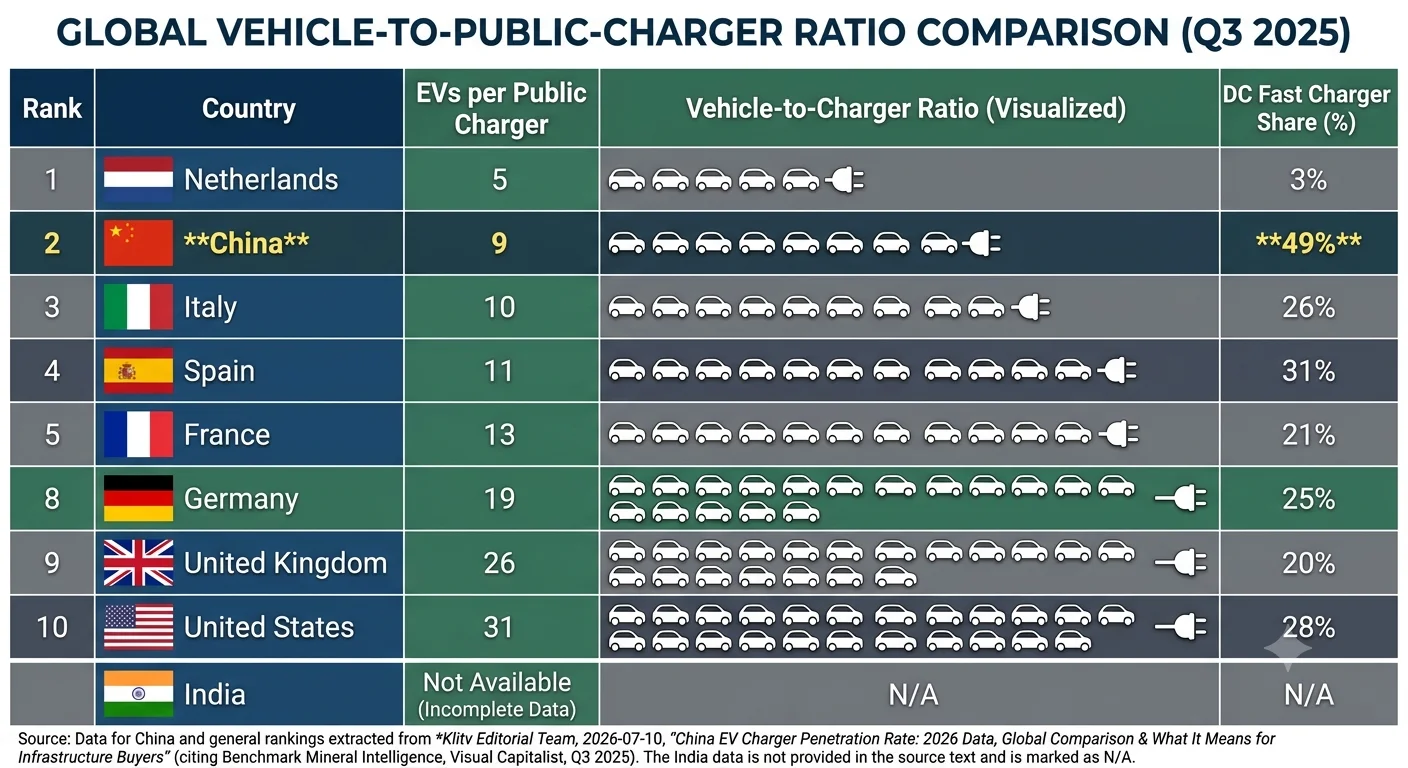
The Netherlands ranks first by public charger density, but its network is almost entirely slow AC chargers, suitable for a geographically compact country with strong residential charging habits. China’s 9 EVs per public charger, combined with the highest fast-charger share in the world, represents a fundamentally different and more operationally capable network.
Scale puts China in a category of its own. With approximately 67% of the world’s public charging points, China has more chargers than Europe and North America combined. The United States, by comparison, had roughly 241,000 public charging stalls (173,000 AC + 68,000 DC fast) at the end of 2025, about 5% of China’s public network.
What the Density Gap Means for Global Markets
The charger density gap between China and other major markets is not just a statistic. It is a demand signal.
The US would need to grow its public charger count roughly 3.4 times just to match China’s current 9:1 ratio, and that does not account for continued EV sales growth. The European Union’s Alternative Fuels Infrastructure Regulation (AFIR) mandates fast-charging stations every 60 kilometers along major highway corridors, but deployment is running behind schedule in most member states.
According to the International Energy Agency, the world needs approximately 15.5 million new public charging points by 2030 to support projected EV adoption. The gap between current deployment rates and this target creates a sustained market for charging hardware, and the manufacturing capacity to meet that demand is overwhelmingly concentrated in China.
Policy Drivers: How China Built the World’s Largest Charging Network
China’s charger penetration did not happen by market forces alone. A deliberate, multi-layered policy framework has driven infrastructure deployment for over a decade.
The Three-Year Doubling Action Plan (2025–2027)
In October 2025, six Chinese government agencies, led by the National Development and Reform Commission (NDRC), jointly issued the “Three-Year Doubling Action Plan for EV Charging Facility Service Capacity.” It is the most ambitious charging infrastructure policy anywhere in the world.
Key targets by 2027:
- 28 million total charging facilities, capable of supporting over 80 million EVs.
- 40,000 new or upgraded highway charging guns rated at 60kW or above.
- Rural coverage expansion: at least 1,400 new DC fast charging guns in townships nationwide.
- 1,000 “unified construction and service” pilot communities to solve residential charging access.
- 5,000+ V2G (vehicle-to-grid) bidirectional charging units deployed across 9 pilot cities.
- Total investment exceeding ¥200 billion (approximately $28 billion) across equipment manufacturing and construction.
The plan explicitly shifts the policy emphasis from quantity to quality, prioritizing high-power charging, grid integration, and operational efficiency over simply adding more charging points.
From Purchase Subsidies to Infrastructure Subsidies
A systematic review published in ScienceDirect in 2026 analyzed China’s two-decade evolution of EV charging subsidy policy. The key finding: China has successfully pivoted from subsidizing EV purchases (which created demand) to subsidizing charging infrastructure (which enables sustained adoption).
Current subsidy structures include:
- Up to 30% of new charging station construction costs covered by government programs.
- Rural charging pilot projects receiving up to ¥45 million (approximately $6.2 million) per county from central government funds.
- Performance-based incentives that reward utilization rates rather than simply installation counts, a direct response to the “zombie station” problem of underutilized subsidized chargers.
The 3C Certification Mandate: A Coming Quality Filter
Effective August 1, 2026, all EV charging equipment sold in China must pass mandatory 3C (China Compulsory Certification) testing. This regulation covers safety, electromagnetic compatibility, and performance standards.
For the industry, 3C certification represents a quality watershed. Smaller manufacturers who cannot meet the standard will exit the market. Larger, established manufacturers, many of whom already hold international certifications like CE, UL, and TÜV, are positioned to consolidate market share. For international buyers sourcing from China, 3C certification provides an additional layer of quality assurance when evaluating suppliers. For more on quality benchmarks, see Klitv’s guide on China’s EV charging standards.
Challenges Beneath the Headlines: Profitability, Regional Gaps, and Grid Constraints
The scale of China’s charging network is impressive, but the data also reveals significant structural challenges. Understanding these challenges matters for anyone evaluating the market, whether as an operator, investor, or equipment buyer.
The Operator Profitability Crisis
Despite — or perhaps because of — rapid infrastructure expansion, most public charging operators in China are not profitable. Service fees have been driven down to as low as ¥0.2/kWh (approximately $0.028/kWh), well below the breakeven point for most stations.
Consider the case of one operator in Zhejiang province, documented by Chinese financial media outlet 36Kr: a 16-charger station with a ¥1.5 million (approximately $210,000) initial investment generated ¥429,000 in annual operating revenue. After accounting for electricity costs, depreciation, and financing expenses, the station posted a net loss of ¥240,000 (approximately $33,000) in its first year.
TELD, China’s largest charging operator by installed pile count, saw per-pile daily revenue drop from ¥25.5 in 2023 to ¥13.6 in the first half of 2025. That is a 47% decline, despite higher overall utilization. The top five operators’ combined market share fell from 65.4% to 61.1%. Smaller regional players entered the market and intensified price competition.
For equipment manufacturers, the profitability squeeze among operators creates both risk and opportunity. Price-sensitive buyers demand cost-competitive hardware. But the operators who survive the consolidation phase will be those with the most reliable, lowest-maintenance equipment — a long-term argument for quality over the cheapest upfront price. For a quantitative assessment of infrastructure returns, use Klitv’s EV charging ROI calculator.
Regional Imbalance: East vs. West, Urban vs. Rural
China’s charging infrastructure is heavily concentrated geographically. The top 10 provinces, all in eastern and coastal China, hold 66.4% of all public chargers, led by Guangdong, Jiangsu, Zhejiang, and Shanghai. In rural counties, where coverage has officially reached 78%, over 60% of installed chargers are low-power AC units unsuitable for the fast turnaround that commercial operations require.
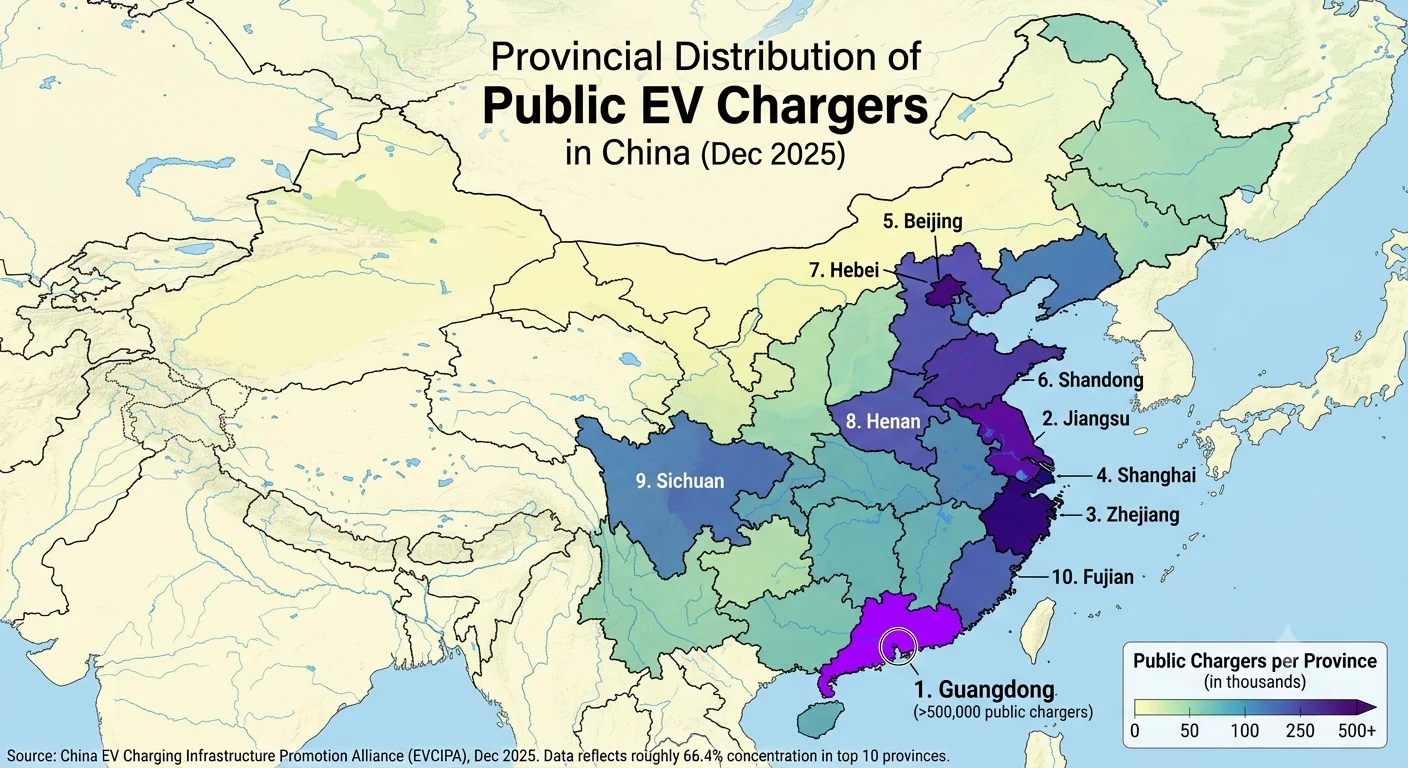
This regional imbalance mirrors the infrastructure challenges faced by developing EV markets globally: deploying hardware is the easy part. Ensuring the right type of charger in the right location with adequate grid support is far more complex.
Grid Capacity and Peak Demand
On China’s busiest travel holidays, the limits of even the world’s largest charging network become visible. During the 2025 Lunar New Year travel rush, highway service areas in central China reported wait times of up to four hours for a charging slot — a phenomenon local media dubbed “queue four hours, charge one hour.”
The underlying issue is peak demand management. Annual charging volume reached approximately 1,100 billion kWh in 2025, and while total grid capacity is sufficient, the instantaneous load from high-power fast chargers concentrated at highway corridors creates local bottlenecks. V2G technology, where vehicles feed power back to the grid during peak periods, remains in pilot stages with 5,000 bidirectional units deployed against a target of millions.
These challenges are not unique to China, but China is encountering them at a scale no other country has yet reached. The solutions being developed — dynamic load balancing, integrated solar-storage-charging stations, AI-driven demand prediction — are likely to become global best practices.
What China’s Charger Penetration Means for Global Infrastructure Buyers
For project developers, charging station operators, and infrastructure investors outside China, the domestic penetration data is more than an interesting statistic. It is a signal about manufacturing capability, technology maturity, and supply chain reliability.
Manufacturing Scale Translates into Proven Reliability
Every one of the 20 million chargers deployed across China represents real-world testing under diverse conditions: the humid summers of Guangdong, the freezing winters of Heilongjiang, the high-altitude plateaus of Qinghai, and the salt-spray coastal environments of Fujian. When a manufacturer has hundreds of thousands of units operating across this range of conditions for years, the failure patterns, maintenance requirements, and durability characteristics are well understood.
China’s EV charger manufacturing ecosystem now produces approximately 65% of the world’s public charging hardware. The supply chain integration is deep: from power modules and control boards to liquid-cooled cables and charging connectors, the component ecosystem is vertically integrated at a scale unmatched elsewhere.
For an infrastructure buyer in Europe, Southeast Asia, or Latin America, this translates into several practical advantages: competitive pricing driven by domestic scale, hardware that has been stress-tested across diverse operating environments, and manufacturers with the engineering depth to support international deployments. For a detailed assessment of the supplier landscape, see Klitv’s guide on EV charger manufacturers in China.
Technology Leadership: Fast Charging and Liquid Cooling
The technology curve in China’s domestic market is running ahead of most global markets. Consider three areas where this matters for international buyers:
Megawatt charging is already commercial in China, not a roadmap item. BYD, Huawei Digital Power, and several dedicated charging manufacturers have deployed 1MW+ stations operationally. For markets planning highway corridors or fleet depots, this technology is available for export now — tested and refined in the world’s most demanding domestic market.
Liquid-cooled charging, which enables sustained high-power delivery in a compact form factor, has moved from premium option to standard offering among leading Chinese manufacturers. Chargers in the 360–720kW range with liquid-cooled cables are now routinely specified for highway service areas and commercial fleet hubs. Klitv’s 120–240kW DC charging pile exemplifies the high-power DC technology being deployed at scale.
Integrated solar-storage-charging stations combine photovoltaic generation, battery energy storage, and DC fast charging into a single installation. This architecture reduces grid connection costs, enables off-peak energy arbitrage, and provides backup power — a particularly compelling model for markets with unstable grid supply or high peak-demand charges.
If your project timeline extends into 2027 and beyond, the hardware you will deploy is being proven in China’s market today.
How to Evaluate Chinese EV Charger Manufacturers
Sourcing charging equipment from China offers genuine cost and technology advantages, but it requires disciplined supplier evaluation. Based on Klitv’s manufacturing experience and global project delivery, here are the criteria that matter most:
1. Certification coverage. Verify that the manufacturer holds relevant certifications for your target market — CE marking for Europe, UL listing for North America, and any country-specific requirements. From August 2026, China’s mandatory 3C certification provides an additional baseline quality filter. See Klitv’s CE marking glossary for European compliance requirements.
2. OCPP compliance. Ensure the hardware supports Open Charge Point Protocol (OCPP) 1.6J or later. Proprietary communication protocols create vendor lock-in and limit your ability to switch backend management systems. OCPP compliance is the interoperability standard that protects your long-term operational flexibility.
3. Export track record and packaging standards. International shipping of heavy electrical equipment requires specific expertise. Look for manufacturers who use industrial-grade packaging (such as wooden crating), provide documented shipping protection measures, and can reference successfully delivered international projects.
4. After-sales support infrastructure. Technical support across time zones, remote diagnostics capability, and availability of spare parts are critical for ongoing operations. A manufacturer’s engineering team size and experience with OTA firmware updates are relevant indicators.
5. Manufacturing quality signals. Factory scale, in-house R&D, precision component sourcing, and quality control processes are tangible indicators. A dedicated production facility with on-site laboratories represents a different level of manufacturing commitment than outsourced assembly.
Conclusion
China’s EV charger penetration rate tells a forward-looking story. The headline numbers — 20 million chargers, a 1.9:1 vehicle-to-charger ratio, 49% DC fast charger share — reflect an infrastructure buildout unmatched in scale and speed anywhere in the world. The underlying data reveals both persistent challenges (the public charging gap, operator profitability, regional imbalance) and clear direction (higher power, smarter grids, quality-driven consolidation).
For global charging infrastructure buyers, the penetration data carries a practical message. The manufacturing ecosystem that built the world’s largest charging network is the same ecosystem producing export-ready hardware today. Chinese manufacturers have deployed more chargers across more diverse operating conditions than any other supply base, and that experience is embedded in the equipment they ship internationally.
The question is not whether Chinese-manufactured charging hardware can meet global project requirements. With proper due diligence on certifications, interoperability, and support infrastructure, the question is which manufacturer is the right fit for your specific deployment.
Planning a charging infrastructure project? Contact Klitv’s engineering team to discuss your power requirements, site configuration, and certification needs. Our full product range spans 7kW AC to 720kW liquid-cooled DC, with OCPP-compliant smart management, CE/UL certification readiness, and project support from over 800 engineers.
Published July 10, 2026. Data sourced from the National Energy Administration of China, China EV Charging Infrastructure Promotion Alliance (EVCIPA), Benchmark Mineral Intelligence, IEA, and industry analysis. All statistics reflect the most recent publicly available data as of the publication date.